
Know-how
Staff planning by guest forecast: how a network proposes the rota
A restaurant in Cologne, 1,004 real days of weather and a small neural network: how a guest forecast becomes a rota that fits the actual rush.
Transcript
1. Sunday evening in a Cologne restaurant: an empty rota fills with question marks, then the same every day: 4 service, 3 kitchen, 1 bar. Warm Friday: too few staff. Rainy Tuesday: too many.
2. 1,004 real days of Cologne weather as bars coloured by temperature, plus holidays, carnival and Christmas parties. Note: demo, real weather, made-up guests.
3. A network learns in 30 epochs. Error per day: ± 12 %, tested on 26 unseen weeks.
4. Forecast for the week of 1 June 2026; the Wednesday before Corpus Christi: 154 guests.
5. This becomes a rota: 9 people, 51 instead of 67 hours.
6. The whole week: 355 instead of 435 hours, €1,680 less wage cost.
7. What if the sun comes out: 227 guests, 12 people, 63 hours.
8. Planning by hand: hours. Checking a proposal: minutes.
9. Which planning eats your time? fk-onlineservices.de
Sunday evening, the rota is waiting
In many restaurants next week's rota gets written on Sunday evening. The owner checks the weather forecast, the booking calendar, maybe last year's figures, and then hands out shifts by gut feeling. Or she skips all that and staffs every day the same: four in service, three in the kitchen, one person behind the bar.
Both usually work out somehow. But the fixed plan costs twice: on a warm Friday evening people are missing and guests wait. On a rainy Tuesday too many stand around, and the wages keep running.
I rebuilt exactly this problem in my demo application. It shows step by step how a business's own figures turn into a guest forecast, and the forecast into a proposed rota.
The example: a restaurant in Cologne
The restaurant in the demo has 90 seats inside and 60 on the terrace. It opens Tuesday to Friday for lunch and dinner, all day at weekends, and is closed on Mondays.
The basis is 1,004 real days of Cologne weather from January 2024 to September 2026, plus the real public and school holidays in North Rhine-Westphalia, carnival and the Christmas season. The guests, however, are made up. They follow patterns that are common in restaurants. With real till data it works the same way, only with your guests instead of invented ones.
The screenshots come from the German version of the demo.
Step 1: What drives the guests
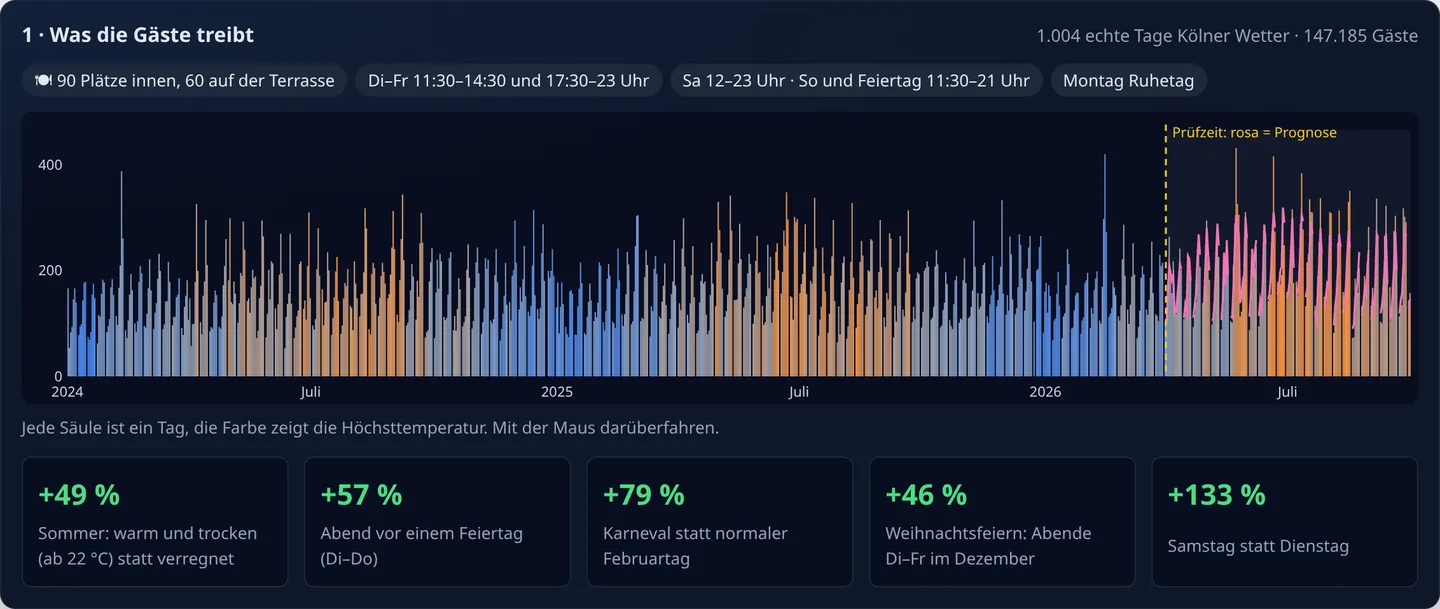
One look at the data shows how much demand swings. Each bar is one day, the colour shows the maximum temperature. In this data a warm, dry summer day brings about half again as many guests as a rainy one, the evening before a public holiday a good half more than a normal evening, and a Saturday more than twice as many as a Tuesday.
Nobody keeps all of these influences in mind at once, least of all on a Sunday evening. A model can.
Step 2: The network learns
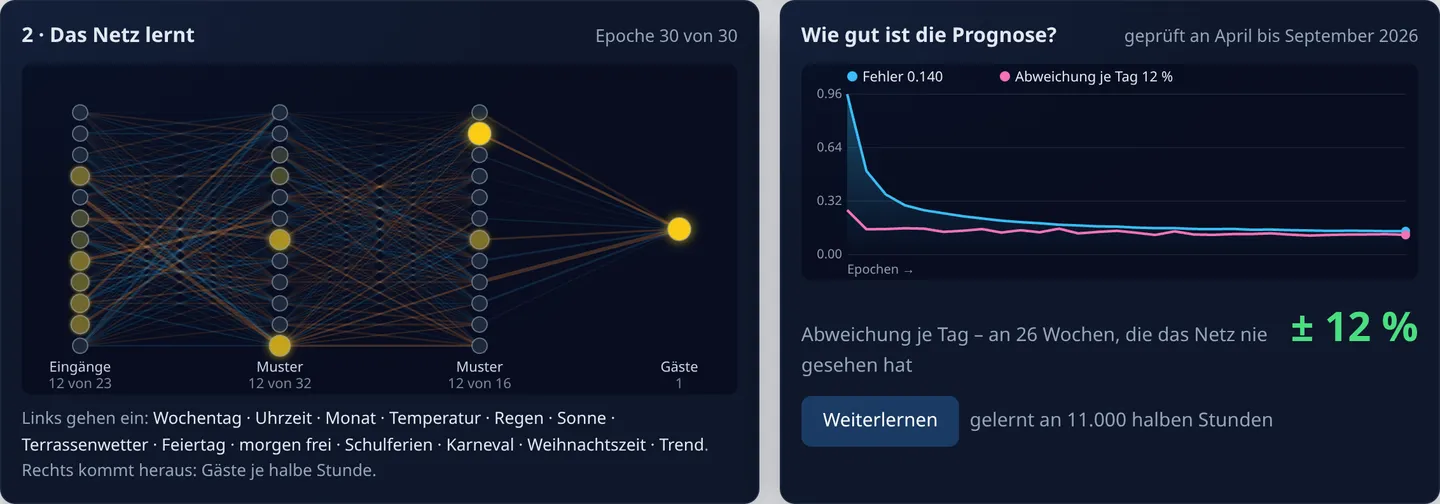
In the demo a small neural network learns right in the browser. For every half hour it gets 23 inputs: weekday, time of day, month, temperature, rain, sunshine, public holiday, whether tomorrow is a day off, school holidays, carnival, Christmas season. From these it has to predict how many guests arrive in that half hour.
It learned from 27 months, about 11,000 half hours. It is tested on the 26 weeks from April to September 2026 that it has never seen. In my run the forecast was off by 12 % per day on average. Because the network starts slightly differently on every training run, the figure varies a little; in my runs it was between 11 and 15 %.
That may not sound very precise, but it is the key point: a rota does not need to know whether 154 or 160 guests are coming. It is enough to know whether it will be a quiet Tuesday or a busy evening before a holiday.
Step 3: Guests become staffing needs
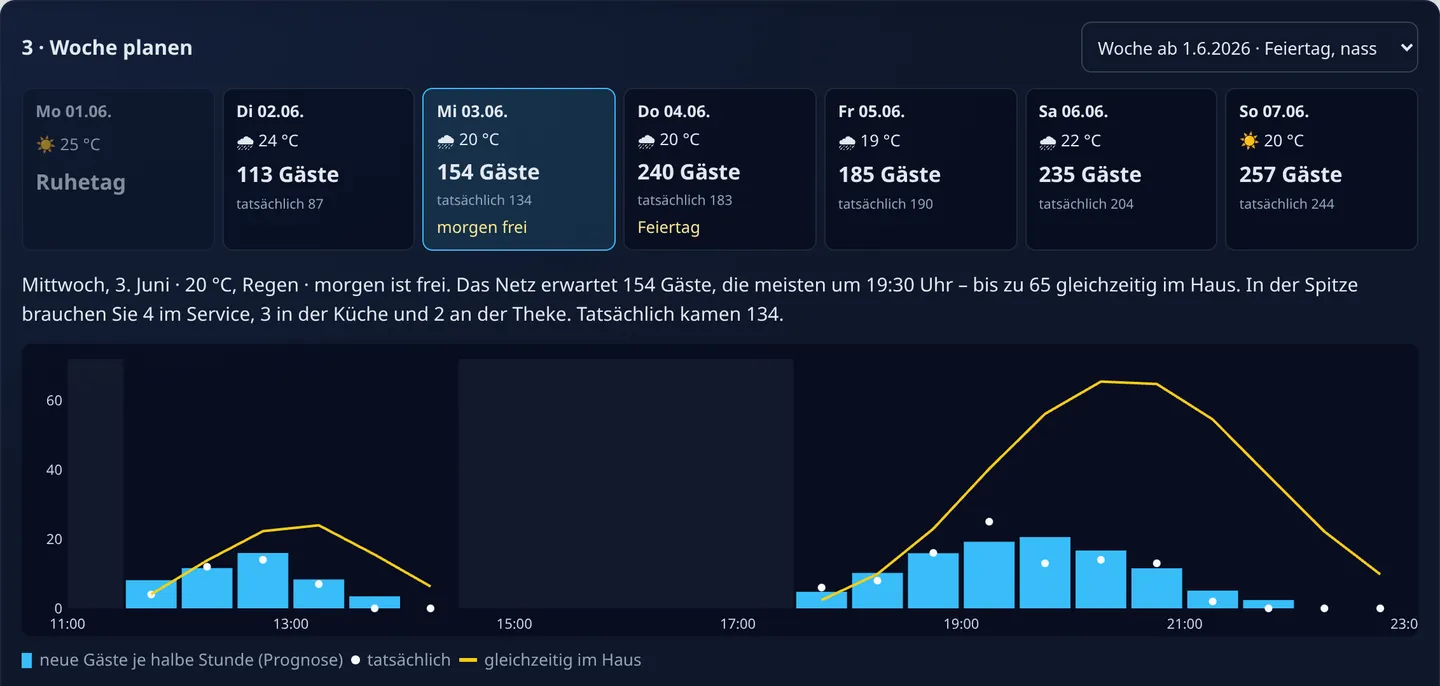
For the week starting 1 June 2026 the network forecasts every day like a weather report. On Wednesday, the evening before Corpus Christi, it expects 154 guests, most of them at 7:30 pm, with up to 65 in the house at the same time. In fact, 134 came that day.
The guests in the house turn into staffing needs, using figures each business sets for itself: how many guests one server looks after, how many meals a cook manages per hour, how long guests stay in the evening. At its peak, Wednesday needs 4 people in service, 3 in the kitchen and 2 behind the bar.
Step 4: The proposed rota
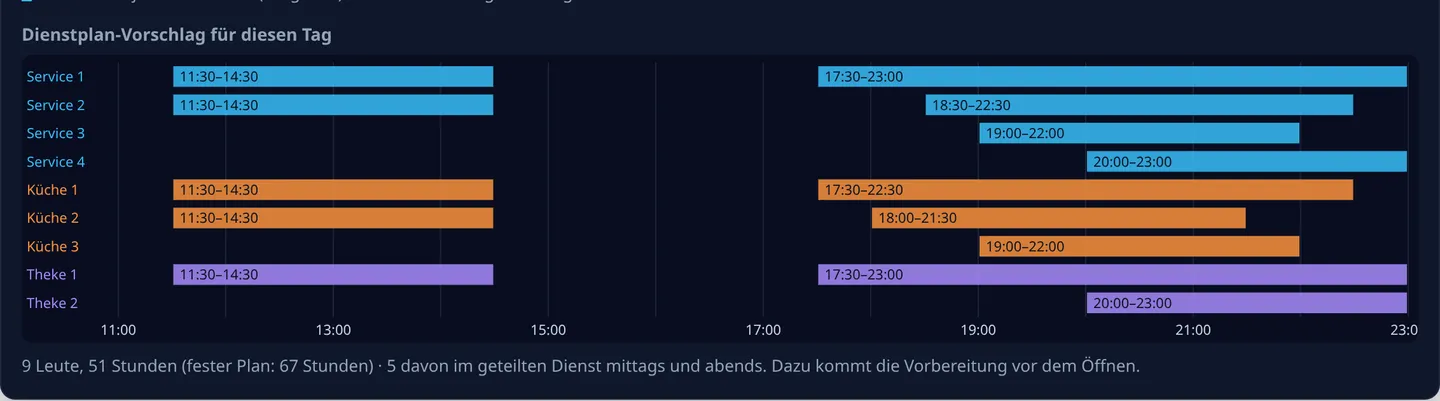
The need per half hour becomes coherent shifts of at least three hours, at lunch and in the evening, some of them split shifts. For Wednesday that is 9 people and 51 hours. The fixed plan would have used 67 hours.
Important: the proposal only contains roles such as "Service 1" or "Kitchen 2", no names. Who takes which shift is still decided by the person who knows the team.
What it means for the whole week
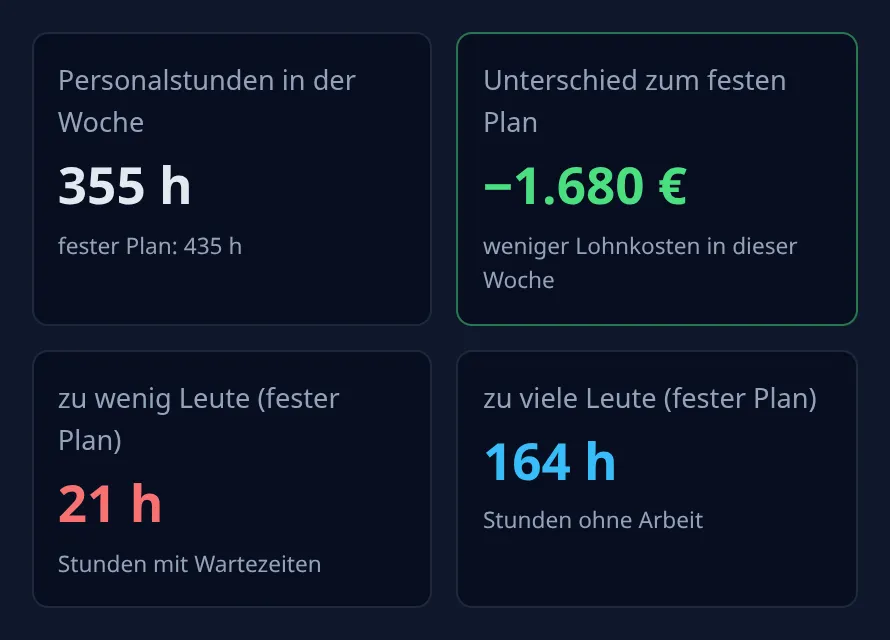
Across the whole week the proposal needs 355 instead of 435 staff hours. At €21 per hour that is €1,680 less in wages in one week.
The other side is more interesting, though. The fixed plan was not simply too generous, it put people in the wrong places: for 164 hours staff stood around with nothing to do, and for 21 hours people were missing because too many guests arrived at once. A forecast moves staff to where they are needed. That saves not only wages but also waiting times and stress.
What if the sun comes out?
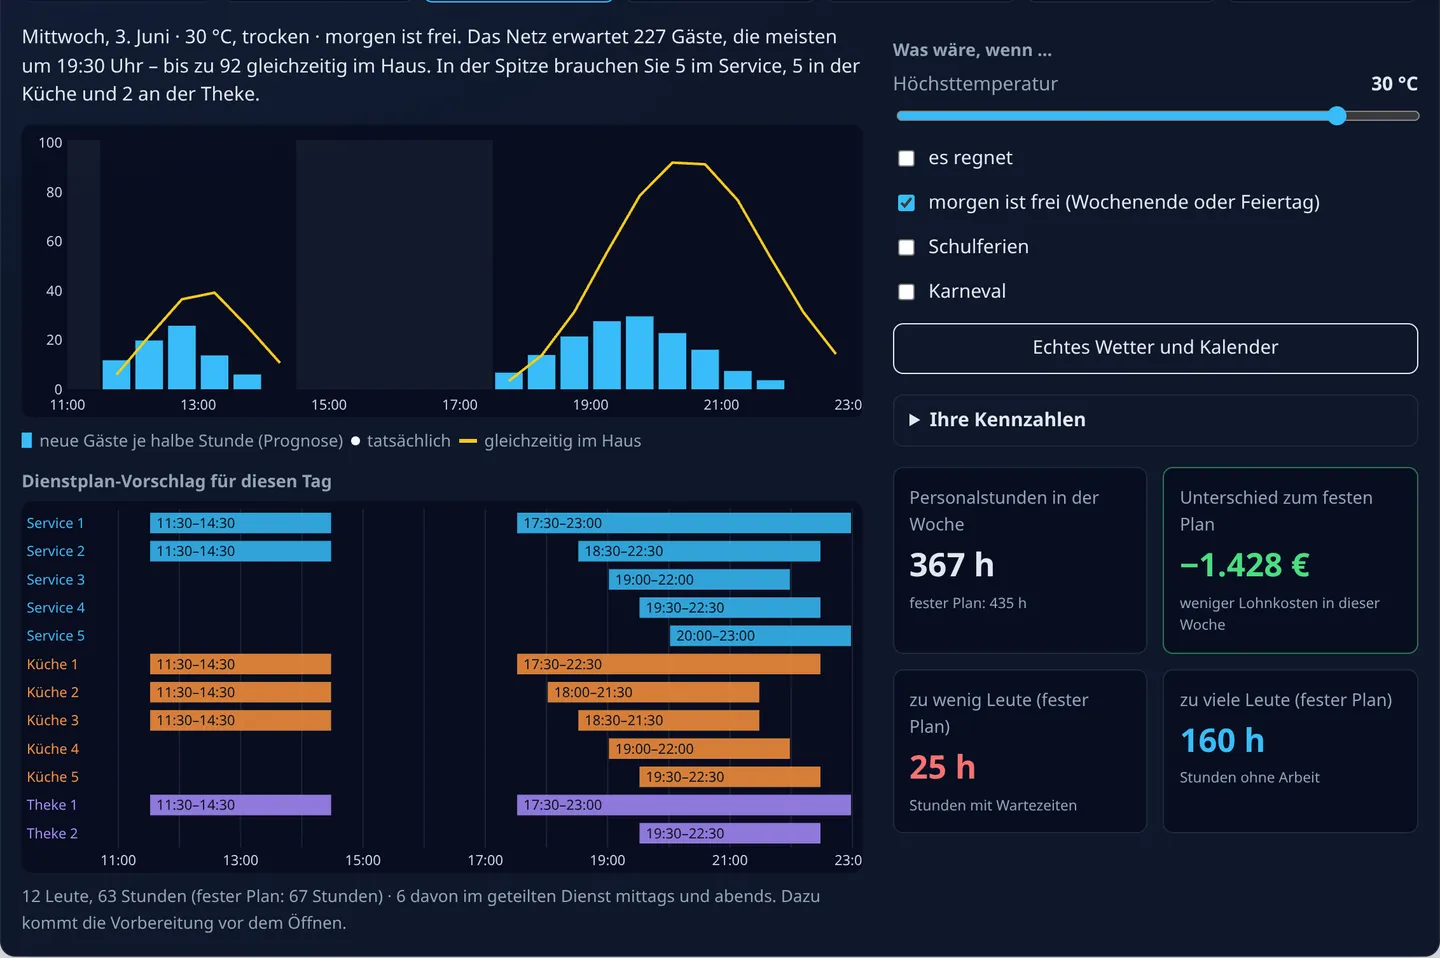
The Wednesday in the demo was rainy. What happens if the forecast changes? Without rain and at 30 °C the network expects 227 instead of 154 guests, and the rota immediately grows to 12 people and 63 hours. The terrace is open, and the evening before the holiday draws people in.
That is how you use it day to day: the weather forecast changes on Thursday, Saturday's plan recalculates, and you see at a glance whether someone else should come in.
And the planning time? An example calculation
The demo does not measure how long a rota takes by hand, and that differs from business to business. So here is an example calculation with open assumptions that you can replace with your own figures:
| By hand | With a proposal | |
|---|---|---|
| Check weather, bookings, last year and estimate demand | 1.5 hours | not needed, the forecast does it |
| Hand out and agree shifts | 1 hour | 45 minutes: check the proposal, assign names |
| per week | 2.5 hours | 45 minutes |
Under these assumptions about 1¾ hours per week are freed up, which over a year of 50 working weeks comes to almost 90 hours. That is not a measurement but a calculation. The bigger lever is what the table does not show: the plan fits the actual rush better.
What the network deliberately does not do
- No employee data. The forecast only works with guests per half hour, not with the performance of individual people.
- No automatic assignment. It proposes roles and times; a person decides who works.
- No data leaving the house. In the demo the network runs entirely in the browser. In a real application the data stays on a server in Germany.
Not just for restaurants
The pattern works wherever demand fluctuates and staff are planned around it: in retail, doctors' practices, call centres, leisure pools or workshops. Instead of guests it is customers, patients, calls or jobs per half hour.
What it needs are figures you usually already have: till receipts or turnover per hour, bookings or appointments, ideally from one to two years. I add weather, public holidays and school holidays from public sources. More on the page Staff planned to demand. You can try the exercise from this article yourself in the demo application.
When is your busiest time?
Describe your business in three sentences and which figures you have. You get a free initial assessment of whether a forecast is worth it for you, and before you commission anything I check on an extract of your data how well your business can be predicted.